Task Types
IELTS Writing Task 1 Multiple Graphs: Structure, Language and Model Answer
Learn how to tackle IELTS Writing Task 1 multiple graphs. Get a clear structure, useful language and a high-scoring combined graphs model answer.
Pandawise AI · Updated · 10 min read
In this guide
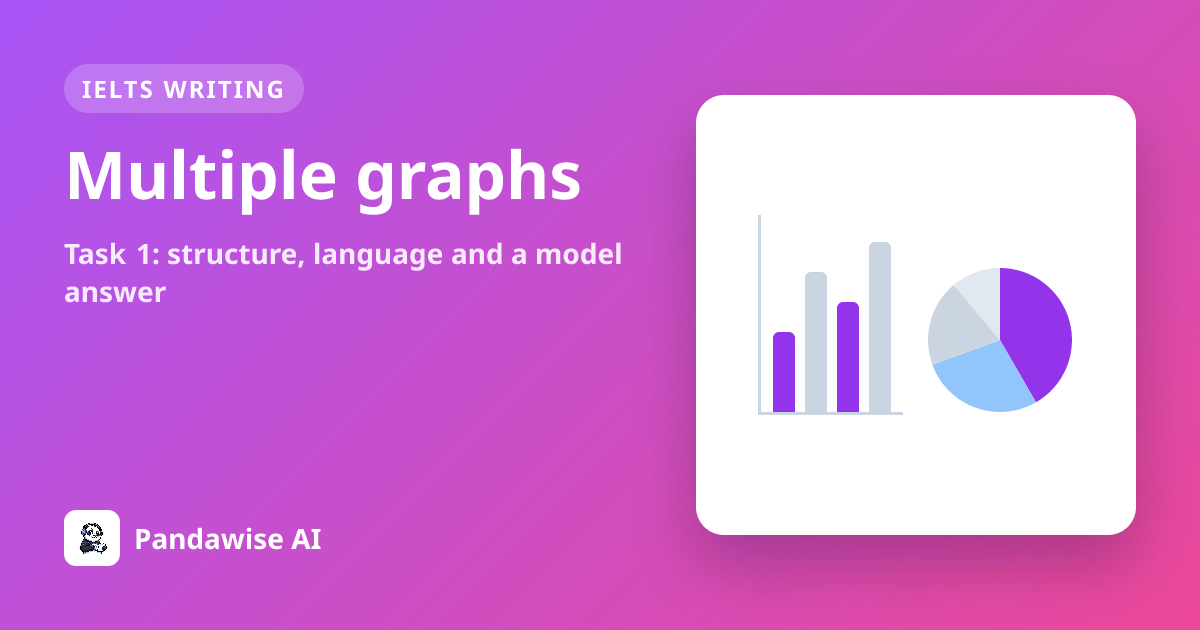
When you open your IELTS Academic Writing Task 1 paper and see not one but two different charts, it can feel overwhelming at first. This task type, often called IELTS Writing Task 1 multiple graphs or IELTS mixed charts, asks you to describe and compare two related visuals – for example, a line graph and a pie chart, or a bar chart and a table. You still need to write at least 150 words in about 20 minutes, so selecting the key information is essential. In this guide, you will learn exactly what the examiner expects, how to plan and structure your answer, and how to use the right language. You will also see a combined graphs model answer and understand why it scores highly.
What Are IELTS Mixed Charts in Writing Task 1?
In the IELTS Academic module, Writing Task 1 always asks you to write a factual report about visual information. The visual can be a single line graph, bar chart, pie chart, table, process diagram or map – but sometimes you are given two charts IELTS Writing Task 1 together. These are known as mixed charts. They always show related data, and your job is to summarise the main features from both and make comparisons where relevant.
This task is part of the 60-minute IELTS Writing test. You should spend about 20 minutes on Task 1, leaving 40 minutes for Task 2, which is an essay. Task 2 counts twice as much as Task 1, so time management is crucial. For Task 1, you must write at least 150 words; if you write fewer, you will lose marks under Task Achievement. There is no maximum word count, but a concise report of around 170–200 words is usually enough to cover the key points without wasting time.
The examiner assesses your report using four criteria, each worth 25% of your Task 1 score:
- Task Achievement: how well you summarise the main features, present a clear overview and report the data accurately.
- Coherence and Cohesion: how logically you organise your paragraphs and link your ideas.
- Lexical Resource: the range and accuracy of your vocabulary.
- Grammatical Range and Accuracy: the variety and correctness of your sentence structures.
For IELTS Writing Task 1 multiple graphs, Task Achievement depends heavily on giving an overview that covers the main point of each visual. You must not simply list every detail; instead, you need to select the most significant information and group it logically. The overview is so important that without one, your Task Achievement band cannot go above 5.0.
A Sample IELTS Mixed Charts Question
Here is a typical question for IELTS mixed charts. The data is presented as a description because no image is available.
You should spend about 20 minutes on this task.
The line graph below shows the number of visitors to three museums in London from 2000 to 2015. The pie chart shows the percentage of visitors by age group to the British Museum in 2015.
Summarise the information by selecting and reporting the main features, and make comparisons where relevant.
Write at least 150 words.
Line Graph Data (visitors in millions)
| Year | British Museum | Science Museum | Natural History Museum |
|---|---|---|---|
| 2000 | 4.5 | 3.2 | 2.8 |
| 2005 | 5.1 | 3.8 | 3.1 |
| 2010 | 5.8 | 4.1 | 3.5 |
| 2015 | 6.2 | 4.4 | 3.9 |
Pie Chart Data (British Museum visitors by age, 2015)
| Age Group | Percentage |
|---|---|
| Under 18 | 15% |
| 18–34 | 30% |
| 35–54 | 35% |
| 55+ | 20% |
How to Plan and Structure Your Answer
Before you start writing, spend 3–4 minutes planning. This will save you time later and help you produce a well-organised report. Follow these steps:
- Read the question carefully: Identify the type of visuals and what they show. Note the time periods and units.
- Identify the main trends for each visual: For the line graph, look at overall increases, decreases or stability. For the pie chart, note the largest and smallest segments.
- Find connections: Ask yourself how the two visuals relate. For example, does the pie chart explain a trend in the line graph?
- Decide on your overview: This should summarise the most important point from each visual in one or two sentences.
- Group the details: Plan one body paragraph per visual, or group by category if the data allows.
Here is a clear paragraph-by-paragraph plan for IELTS Writing Task 1 multiple graphs:
| Paragraph | Purpose | What to Include |
|---|---|---|
| Introduction | Paraphrase the task | Rewrite the question in your own words. State what the visuals show and the time period. |
| Overview | Summarise the main features | The key trend from the line graph (e.g., all museums saw an increase, with one being the most popular) and the main point from the pie chart (e.g., the largest age group). |
| Body Paragraph 1 | Describe the first visual (line graph) | Compare the three museums over time. Use data to support the trends. Start with the most significant one. |
| Body Paragraph 2 | Describe the second visual (pie chart) | Report the proportions of age groups. Highlight the largest and smallest. Link back to the line graph if relevant. |
This structure works for most mixed-chart tasks. Sometimes you may combine the data differently if the visuals are closely linked, but having one body paragraph per visual is a safe and effective approach.
Useful Language for IELTS Mixed Charts
Using a range of appropriate vocabulary and grammar is essential for a high score. Below are some useful words and phrases for describing two charts IELTS Writing Task 1. Remember, these are suggestions – your language should fit the specific data, not a memorised template.
Language for Introductions
| Function | Examples |
|---|---|
| Paraphrasing the task | The line graph illustrates… / The pie chart gives information about… / The two visuals show… |
| Stating the time period | between 2000 and 2015 / in 2015 / over a 15-year period |
Language for Overviews
| Function | Examples |
|---|---|
| Introducing the overview | Overall, / It is clear that… / The most noticeable feature is… |
| Describing main trends | there was a steady increase in… / the majority of… / the largest proportion was… |
Language for Body Paragraphs
| Function | Examples |
|---|---|
| Comparing | compared to / in contrast / while / whereas / similarly |
| Describing changes (line graphs) | rose gradually / increased sharply / remained relatively stable / experienced a slight decline |
| Describing proportions (pie charts) | accounted for / made up / represented / the percentage of… was… |
| Reporting data | at 4.5 million / with 35% / reaching a peak of… |
Avoid overusing linking words like "firstly", "secondly" or "finally". Instead, use a mix of cohesive devices naturally. Also, do not give opinions or reasons not shown in the data – this is a factual report.
Combined Graphs Model Answer
Here is a high-scoring model answer for the sample question above. It follows the recommended structure and uses a range of language.
The line graph illustrates the number of visitors to three London museums – the British Museum, the Science Museum and the Natural History Museum – between 2000 and 2015, while the pie chart shows the breakdown of visitors to the British Museum by age group in 2015.
Overall, all three museums experienced a steady rise in visitor numbers over the period, with the British Museum consistently attracting the most visitors. In the final year, the majority of its visitors were aged between 18 and 54.
Looking at the line graph in more detail, the British Museum saw a gradual increase in visitors from 4.5 million in 2000 to 6.2 million in 2015, remaining the most popular venue throughout. The Science Museum and the Natural History Museum followed similar upward trends, though their figures were lower. The Science Museum rose from 3.2 million to 4.4 million, while the Natural History Museum grew from 2.8 million to 3.9 million over the same period.
As for the pie chart, the 35–54 age group accounted for the largest share of the British Museum’s visitors in 2015, at 35%. This was followed by the 18–34 category at 30%, meaning that together these two groups represented nearly two-thirds of the total. Visitors aged 55 and over made up 20%, while the smallest proportion was the under-18 group, at just 15%.
Word count: 198
Why the Model Answer Works
This combined graphs model answer demonstrates the key features that examiners look for.
Task Achievement: The report fully addresses the task. It summarises the main features of both visuals, includes a clear overview covering each chart, and selects relevant data without listing every detail. Comparisons are made where appropriate, such as between the museums and between the age groups.
Coherence and Cohesion: The answer is logically organised. The introduction paraphrases the task, the overview summarises the key points, and each body paragraph focuses on one visual. Cohesive devices like "while", "though" and "as for" are used naturally, and the information flows smoothly.
Lexical Resource: A good range of vocabulary is used, including synonyms ("illustrates", "shows"), precise verbs ("experienced a steady rise", "grew from"), and proportion language ("accounted for", "made up"). The writer avoids repetition and uses words accurately.
Grammatical Range and Accuracy: The report includes a mix of simple and complex sentences. Structures like "with the British Museum consistently attracting the most visitors" and "meaning that together these two groups represented nearly two-thirds" show grammatical flexibility. There are no errors.
Common Mistakes That Lower the Band
Even strong candidates can lose marks on IELTS Writing Task 1 multiple graphs. Here are some common pitfalls to avoid:
- Writing a separate overview for each visual: The overview should be a single paragraph that summarises the main point from both charts together. Splitting it into two overviews can disrupt coherence.
- Describing every data point: With limited time and words, you must select only the most significant information. Listing every number shows poor analytical skills and may lead to a low Task Achievement score.
- Ignoring the connection between the visuals: The two charts are given together because they are related. If you describe them in complete isolation without any linking, you miss an opportunity to show higher-level comparison skills.
- Giving opinions or reasons: Task 1 is a factual report. Do not write "This might be because…" or "It is interesting that…". Stick to what the data shows.
- Using a memorised template: Examiners are trained to spot template language. Phrases like "It is evident that…" or "A glance at the graph reveals…" can sound unnatural if overused. Focus on describing the specific data in your own words.
- Poor time management: Spending more than 20 minutes on Task 1 leaves less time for Task 2, which is worth twice as many marks. Practise writing a complete report within the time limit.
How to Practise and Key Takeaways
To improve your skills with IELTS mixed charts, regular practice with realistic tasks is essential. You can find many sample questions online, but it is also important to get feedback on your writing. Using a tool like IELTS Writing lessons on Pandawise can help you practise under timed conditions and receive guidance on your structure and language.
Here are the key points to remember:
- Spend 3–4 minutes planning: identify the main features of each visual and decide on your overview.
- Structure your answer with an introduction, an overview and one body paragraph per visual.
- Use a range of vocabulary for describing trends, proportions and comparisons, but keep it natural.
- Always include an overview that covers the main point of each chart – this is essential for a high Task Achievement score.
- Manage your time carefully: aim to finish your report in 20 minutes so you can focus on Task 2.
- Avoid common mistakes like describing every detail, giving opinions or using memorised phrases.
With a clear approach and consistent practice, IELTS Writing Task 1 multiple graphs can become a straightforward part of the exam. For more help with other Task 1 question types, see our guides on IELTS Academic Writing Task 1 line graphs, IELTS Academic Writing Task 1 bar charts and all IELTS Writing task types.
Write it and get feedback on every criterion
Exam-style writing tasks marked by an AI examiner on all four criteria, with a band for each.
Explore the appFrequently asked questions
How do I write an overview for IELTS Writing Task 1 with two charts?
Your overview should summarise the main point from each visual in one or two sentences. Do not write separate overviews. For example, if you have a line graph and a pie chart, state the overall trend from the line graph and the most significant feature from the pie chart. This shows the examiner you can see the big picture across both visuals.
Can I write more than 150 words for IELTS Writing Task 1 multiple graphs?
Yes, you can write more than 150 words. There is no maximum word limit, but a concise report of around 170–200 words is usually enough to cover the key features without wasting time. Writing too much may leave you less time for Task 2, which is worth more marks.
Should I describe every detail in IELTS mixed charts?
No, you should not describe every detail. Your task is to select and report the main features. Trying to include all data points can make your report unfocused and may lower your Task Achievement score. Focus on the most significant trends, comparisons and proportions.
How are IELTS Writing Task 1 multiple graphs scored?
Your report is scored on four criteria, each worth 25%: Task Achievement (how well you summarise the main features and present an overview), Coherence and Cohesion (logical organisation and linking), Lexical Resource (range and accuracy of vocabulary) and Grammatical Range and Accuracy (variety and correctness of sentences).
What is the best structure for two charts IELTS Writing Task 1?
The best structure is: an introduction paraphrasing the task, an overview summarising the main point of each visual, and two body paragraphs – one describing the first visual and one describing the second. This keeps your report clear and well-organised, which helps with Coherence and Cohesion.